
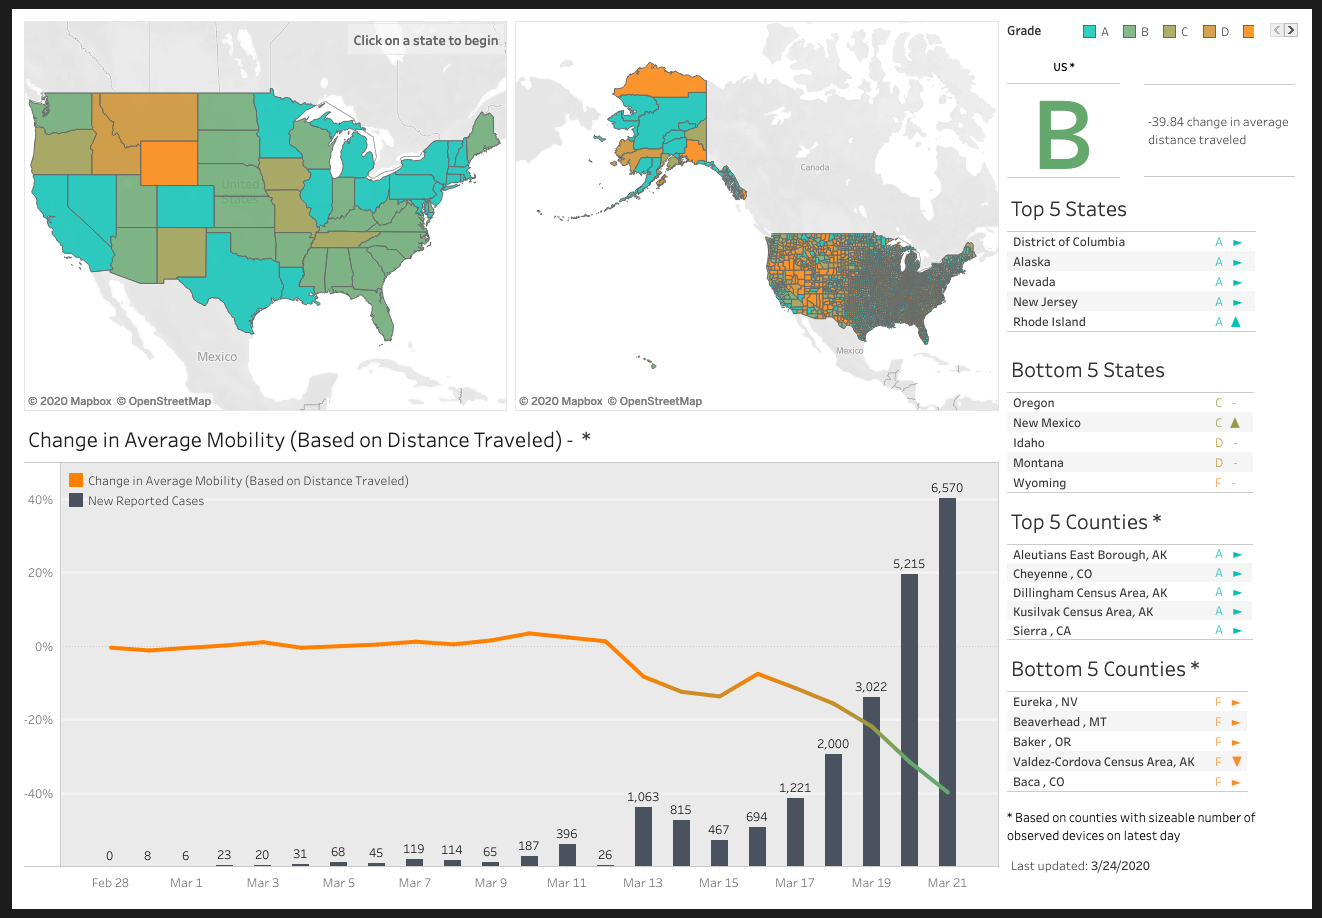
By now, we've all heard the importance of social distancing in the effort to contain COVID-19. But how well are Americans heeding this advice? Unacast, a company that specializes in human mobility insights, created a scorecard that tracks how well each state (and even each county) is doing at staying home. Using one of our favorite visualization tools, Tableau, they created a dashboard to visualize these insights.
Using anonymized location tracking data from millions of phones across the country, they started by looking at the change in average distance traveled, which their analysis found correlates with the number of confirmed cases. This metric allowed their research team to capture ways in which Americans are altering their daily lives, such as working from home and avoiding non-essential travel.
Scores are calculated on an A-F grading scale, where:
- A: >40% decrease in average distance traveled
- B: 30-40% decrease
- C: 20-30% decrease
- D: 10-20% decrease
- F: <10% decrease
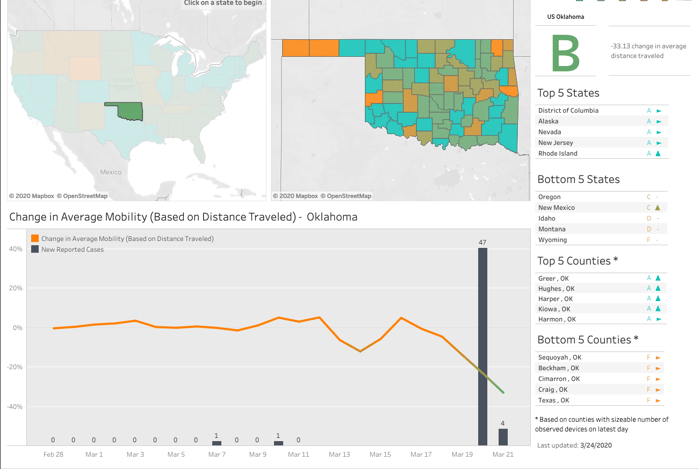
As a whole, Americans reduced their travel by 39.84%, giving us a B (verging on an A). Washington DC has made the most progress with a 60% decline in average distance traveled, and Wyoming made the least progress with 0.21% change. Here in Oklahoma, we're on par with the average of the nation, scoring a B with a 33% reduction in average distance traveled.
It's important to note that the data lags a few days, so these numbers may look far different now. But kudos to everyone doing their part to combat this virus. Check out the dashboard yourself for some more insights and be sure to visit Jenn's blog post from last week on COVID-19 data resources.
Resources:
Stewart

Stewart is passionate about all things research. Designing studies, analyzing data, and moderating interviews - Stew does it all. Outside of research, he enjoys spending time with his wife and kids and trying new recipes on the grill.