
Yesterday, a magnitude 4.2 earthquake shook the San Fernando Valley. The earthquake, a pretty normal occurrence in that part of the world, got me thinking. I wonder how many earthquakes are happening daily around the globe?
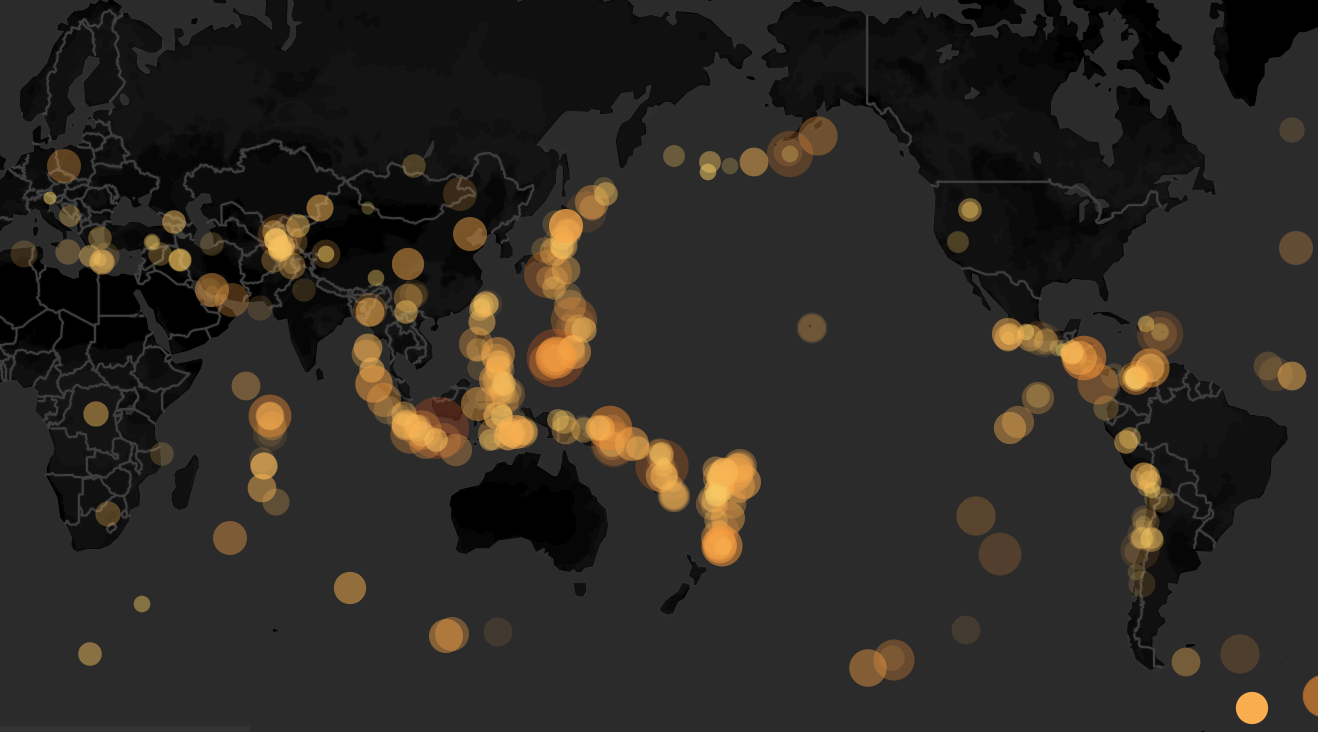
According to the Incorporated Research Institutions for Seismology, 903 earthquakes were recorded in July alone. Armed with data detailing latitude, longitude, time, date and magnitude, I mapped the earthquakes using my favorite visualization tool, Tableau.
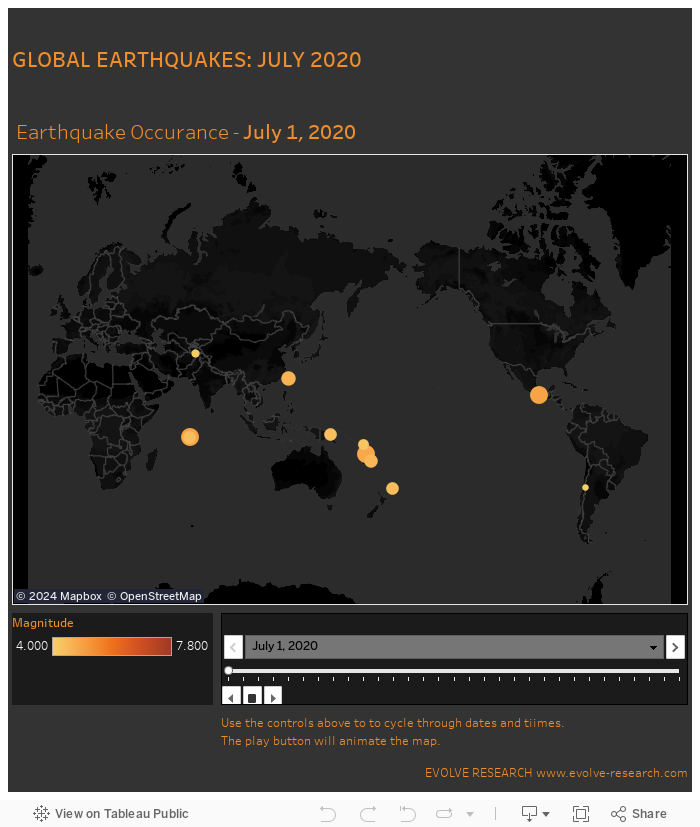
The animation cycles through the daily earthquakes. It looks better when viewing the animation by the hour...but the online version of Tableau doesn't load the data as quickly as the desktop version, sadly, which results in a rather slow animated visualization.
EvolveKev

Kevin is all about research. Qualitative, quantitative, UX, you name it. When he's not researching, he's to be found laying down beats in his studio and hanging out with his dogs (and girlfriend). Woof.