Summer vacation season is here, and many of us (about 3,636,584 according to 2016 statistics) flock to Las Vegas in August. Want to come back a winner?
July through October are huge for Vegas. It’s during this time period Vegas has the biggest influx of visitors. It’s also the time when Vegas casinos make their most money from games. In fact, in July of 2016, casinos along the Las Vegas Strip took in over $600 million dollars alone!
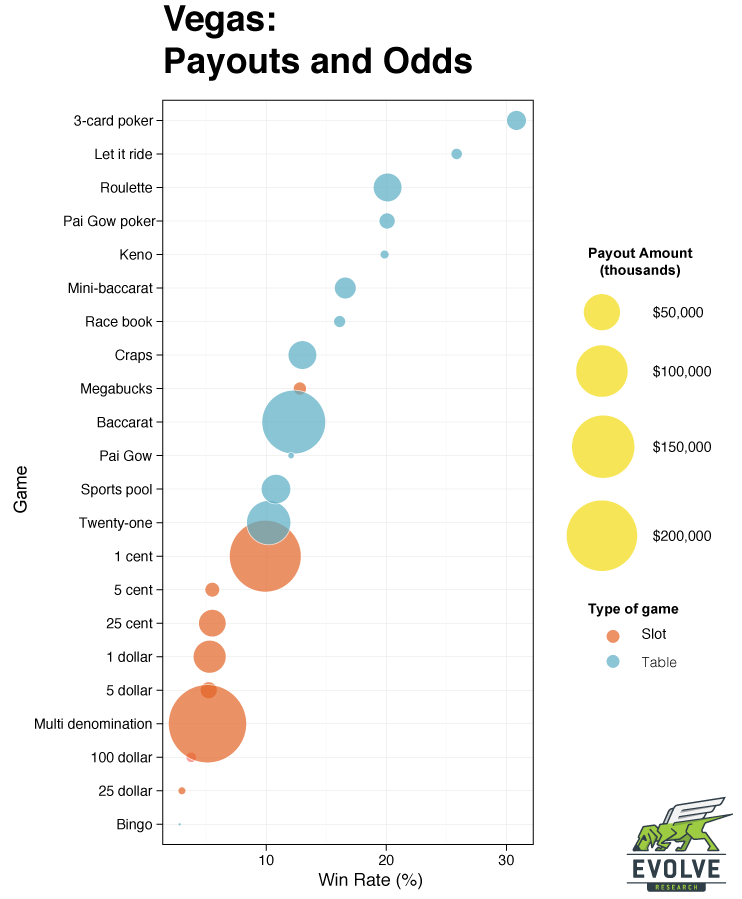
Since statistics and data are key to what we do, we thought we’d use our number-know-how to produce a data visualization based upon casino games and their relative winning odds and amounts.
The data was compiled from the Nevada Gaming Control Board, and Evolve put together the visualization.
Evolve’s Insight
- The higher the chance of winning, the less the payout – d’uh!
- DON’T go near those $100 and $25 slot machines – you won’t win, and if you do you won’t win much.
- Give 3-card poker a whirl. Best chances of winning in the house.
- Bingo. LOL.
What this chart does not tell you is how popular each game is. The payout amount for the 1 cent slots is huge, but that’s probably due to the vast number of people playing those machines. So, as with any data – use a little caution!
Sources:
http://www.lvcva.com/includes/content/images/media/docs/ES-YTD-2016.pdf
http://gaming.nv.gov/index.aspx?page=149
Kevin is all about research. Qualitative, quantitative, UX, you name it. When he's not researching, he's to be found laying down beats in his studio and hanging out with his dogs (and girlfriend). Woof.