Well, it is finally November, and we are officially in full fall season mode - just patiently waiting for the weather to cool down and the leaves to start falling while keeping our research minds in tact! Did you miss out on our October posts? Just in case, here's our selection of the most attention-grabbing articles we've seen this past month.
- America’s population re-imagined on this data viz map – Our most popular tweet was a data map showing the various ways America’s population could be re-distributed. Fun fact: if the USA map were to be split based on equal population then Oklahoma would lose its panhandle, and I am not sure if ‘everything would be bigger in Texas.’
- Looking back on the California wildfires – A Washington Post news story incorporated live data visualization, charts, maps, and pictures to show where and how the fires developed in Northern Cali.
- Red Herrings and the Online Survey Experience – Do you have trouble getting quality completes in your surveys? In the spirit of Halloween, we’re telling you how you can use these trick questions to treat your respondents to a better online survey experience.
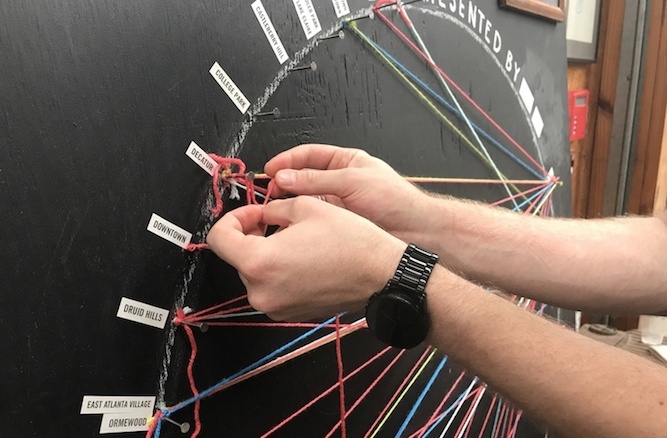
- #LivingInfographic – This sweet chart project was created using string, nails, and chalk and designed for marketers and artists alike. It’s a fantastic way to study the daily commute of Atlanta metro residents using location, distance, time and modes of transportation. It has me in the mood for DIY projects. P.S. you might want to follow @whiskeyfoxxtrot on Instagram for some creative inspiration.
- World's Most Valuable Start-ups mapped out – It’s not too surprising that USA and China have companies that encompass the top 10 list of most valuable startups in the world. On that list: Uber, Airbnb, Pinterest bringing in a whopping total of $109.6B. Want to see more? This data map shows each industry segmented by color across the world.
At Evolve, we make it our goal to stay up to date on the latest news and trends in marketing, advertising, data visualization and market research. That’s how we provide cutting-edge, innovative research to our clients locally, regionally and nationally. If you want a steady stream of interesting industry-related news, then follow us on Twitter, Facebook or LinkedIn.
Posted by
Jennifer
Jennifer is all things project management, but she is also passionate about qualitative research, and creating unique graphics and data viz. When she isn't consumed with work, you can find her playing outside with her husband, son and their two blue heelers, starting her next DIY project, or volunteering in the community.