
This week we continue to examine our favorite research tools and techniques. Last week, Brinkley and Stew spoke about Q Research Software and Maxdiff. This week Jenn and Kev dive into their must-have solutions...
Jenn
_pp4671606637397020892862510.webp?width=1920&name=Participant%20View_Chat%20(1)_pp4671606637397020892862510.webp)
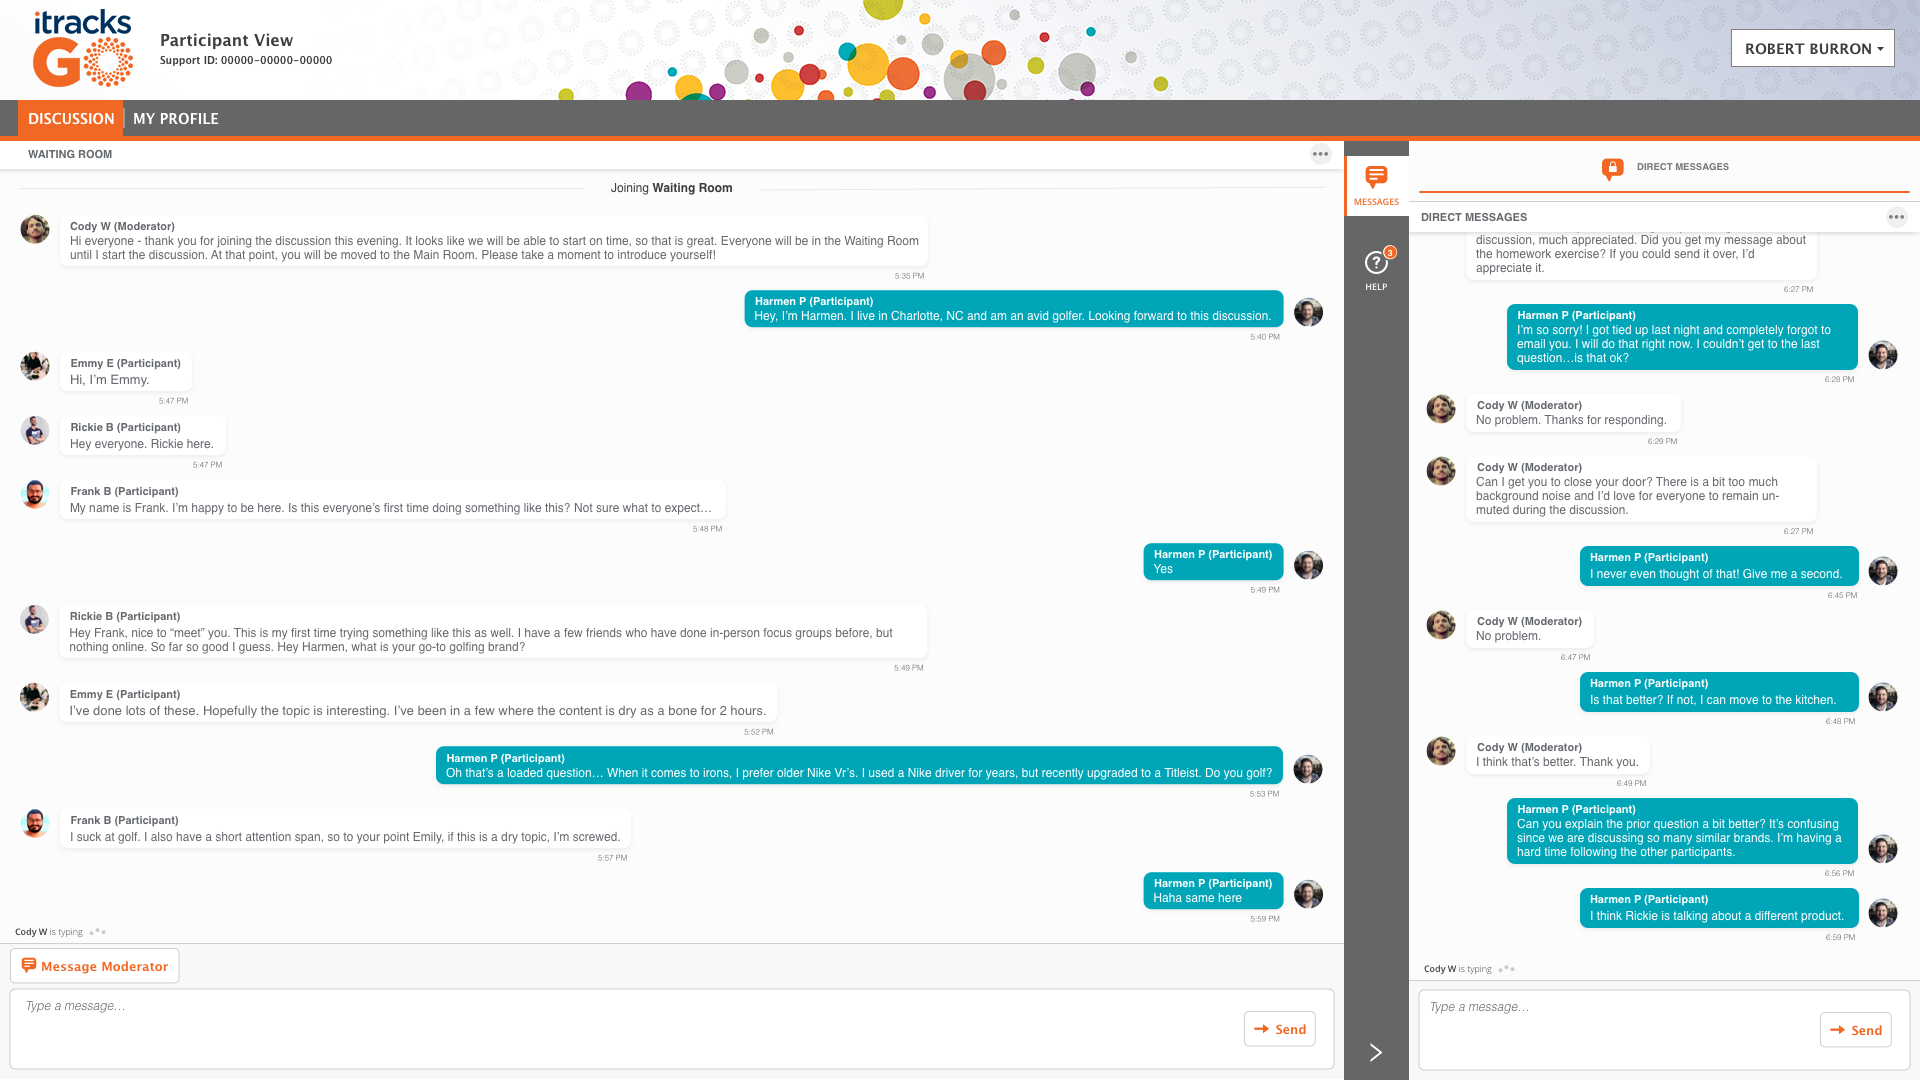
Favorite Method: Online Bulletin Board Focus Groups
While quantitative data can give you more concrete data and be statistically analyzed using various research tools and methods, qualitative data is more colorful and in-depth. One qualitative research methodology that I am a fan of is Online Bulletin Board Focus Groups.
Not to take anything away from traditional focus groups and the more modern "zoom" groups, online bulletin board focus groups give respondents' the opportunity to answer questions openly and honestly.
The methodology eliminates "groupthink." Since it relies on written communication, everyone's opinions are voiced, not just those with more dominant or confident personalities.
Additionally, our platform allows participants to respond to other people's comments/answers, giving us extra insight to dive into during our analysis. A few key reasons why I love this type of research are listed below:
- The groups are genuinely anonymous - respondents cannot see one another, and they do not know one another's names empowering them to provide incredibly candid answers.
- The technique encourages independent and collaborative thinking. Respondents answer all questions without being influenced by the opinion of others. Before someone can observe and comment on the views of others, they must answer the question first, which allows us to learn from respondents as individuals and a group.
- The format creates a unique sense of community. Bulletin board focus groups take three days to complete, during which respondents learn a lot from one another. This is a huge benefit, especially when the research topic is personal, like anything public health-related. When it comes to writing a report after conducting the groups were never short on data. In fact, online bulletin board focus groups yield an incredible amount of extra insight, which is always valuable to the client.
Kev
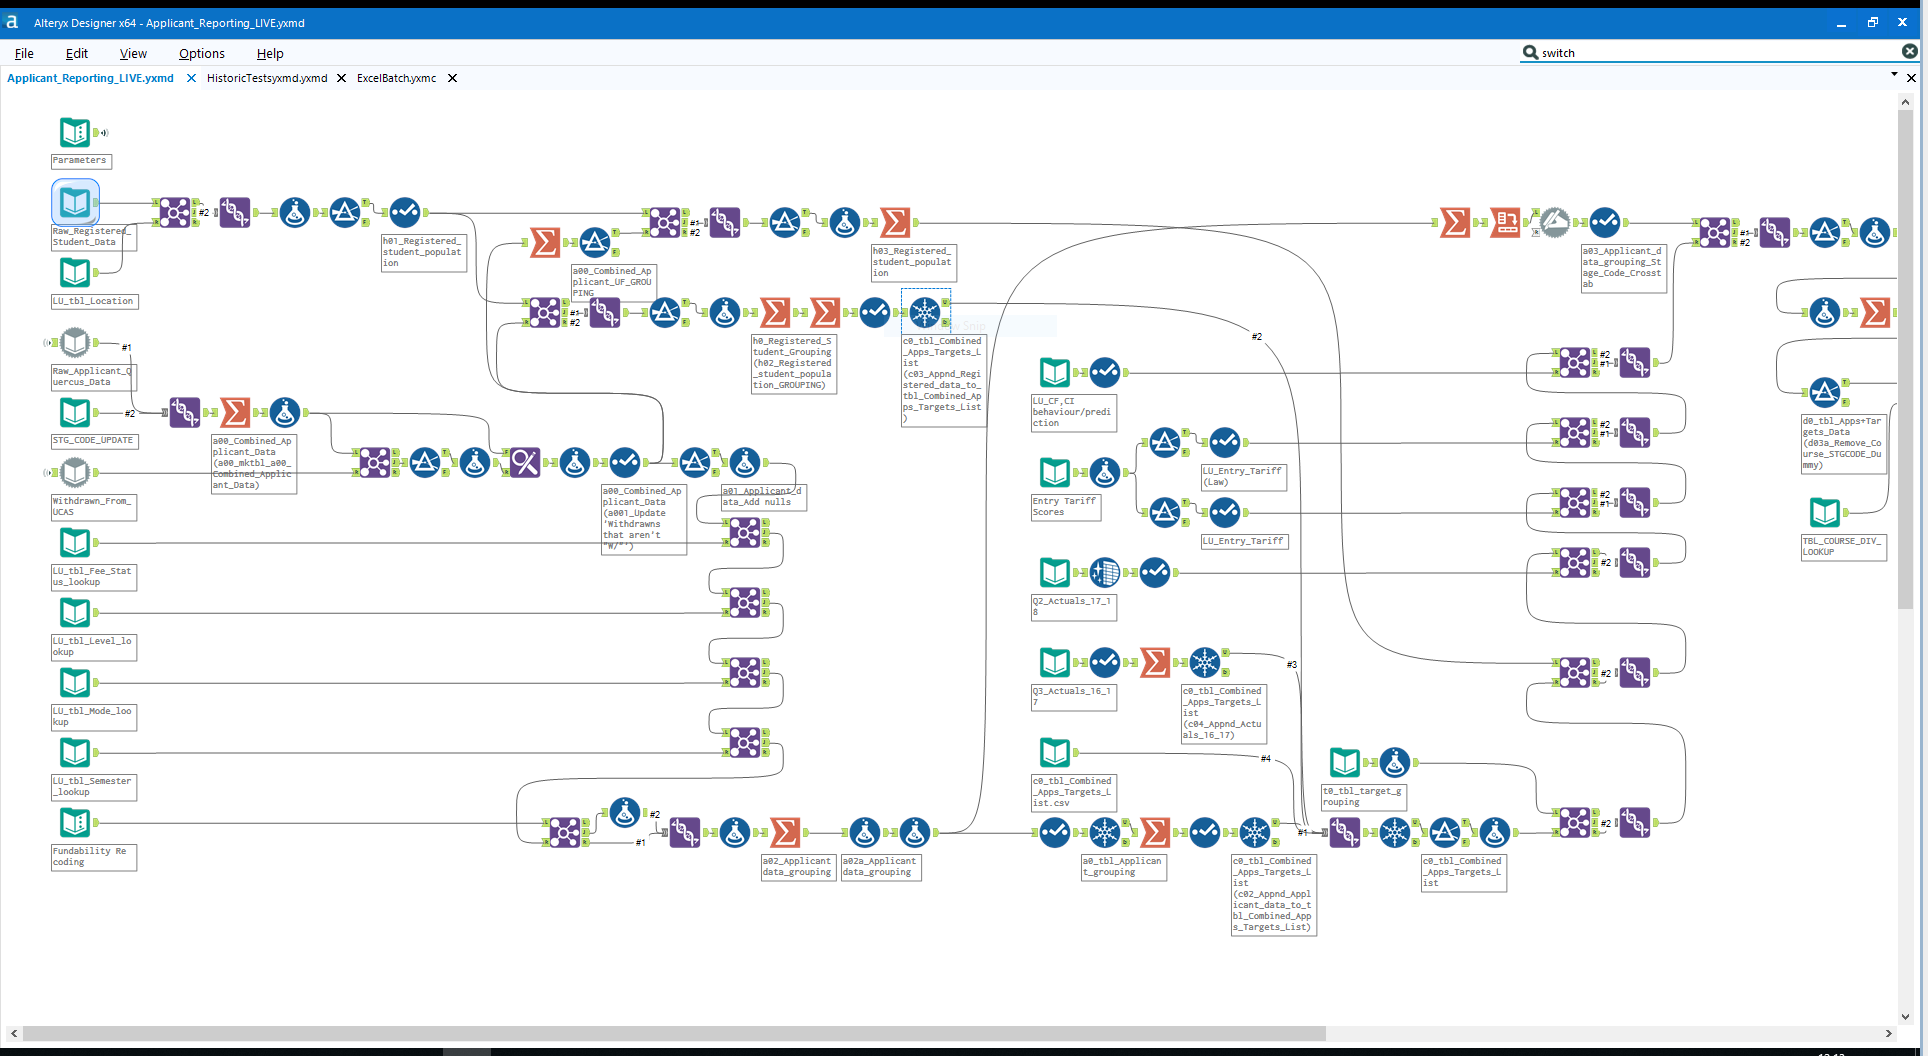
Favorite Tool: Alteryx Designer
Time is money, and Alteryx saves our clients both. It's a powerful data-wrangling tool that we use in a variety of ways.
Survey Automation: Managing tracking study datasets can be an uphill assignment. Datasets need to be carefully merged together. Any change to a monthly questionnaire can result in data mismatches which can cause our carefully collected data to crash to the ground (figuratively and literally).
Alteryx allows us to set up workflows that automatically pull in data from each research wave and seamlessly merge everything into a convenient single data file. Questions that differ from wave to wave are handled intelligently and placed in the combined dataset.
Data Transformation: Alteryx is a magnificent data manipulation tool. We can take survey data and compute new variables based upon combinations of complex information. Computing personas from quantitative data, for example, is easy to do. Even better, we can add these transformations to our tracking study workflows, meaning we don't have to go back into historical datasets to individually add new variables. We can add new variables long after the fact, and all in one fell swoop.
Unifying Data from Multiple Sources: Alteryx allows us to pull together information from multiple disparate sources. For example, we might have publically available housing characteristics in one dataset as a Microsoft Access file, geographic characteristics in another as a Tableau .hyper file, lifestyle segmentation in a Google spreadsheet, and survey data in an SPSS file. Traditionally, this data is siloed, and it's hard to extrapolate meaningful insights.
Alteryx allows to link these sources together, flip and pivot the data, and ultimately pull massively impactful information together. Using the example in the paragraph above, we could show that people who are highly likely to recommend product X live in specific geographies of the US, in homes that fall within a particular price range, and who are Empty Nesters. That's an incredible amount of valuable intelligence.
EvolveKev

Kevin is all about research. Qualitative, quantitative, UX, you name it. When he's not researching, he's to be found laying down beats in his studio and hanging out with his dogs (and girlfriend). Woof.